How to Use the Log Window
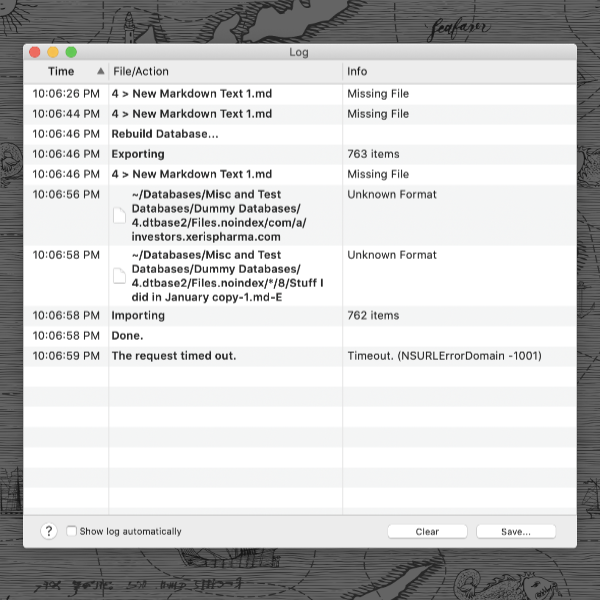
Whether you are experiencing issues in DEVONthink, doing database maintenance routines, or running processes like archiving emails, the Log window is a handy utility pane that provides information useful in different situations. Here is how to access the log and some of the things you may see reported there.
You open the Log window via Window > Log. For many items, e.g., missing files, you can Control-click items in the log and choose options like revealing the item in the database. Alternately, there is a Log toolbar button on the right side of a main window. Clicking on it opens the Log popover if the Log window isn’t already open. The toolbar item also shows a badge when there is something reported in the log.

Here are some common things you’d find in the Log window:
- Maintenance routine results: The results of maintenance reports from automatic or manual database verifications are shown here. These could be things like reports of missing files or successful verifications.
- Database rebuild results: If you do a File > Database Rebuild, you will see a maintenance report as well as the exports and imports.
- Email archiving issues: If emails have already been archived into a specific database or perhaps you have an email failing to import, those items are reported here.
- Sync reports: If you know of or suspect a sync error, this is the first place you should check. Sync issues as well as the success or failure of sync cleaning will be reported here.
- Smart rule script errors: If you are using an Execute Script action in a smart rule, any runtime errors will be shown. So if you’re running a smart rule with a script and it’s not working, check the Log window.
Also note the two buttons at the top of the popover and window: Clear and Save. If errors have been addressed or the reported items are of no concern, you can clear the log. If you are reporting an issue to our support team, you can press the Save button and send the log as well.
Note: This article deals with an older app generation. Interface elements, menu paths, and procedures could differ.
